Tag Archives: stats

Rafael Ramírez definitively departs the reality-based community

It was nice while it lasted, but Venezuela’s minister of people’s power for oil and mining, Rafael Ramírez, has left us. He used to be considered a pragmatist and would offer plans that, while, ambitious, were often within the range of the human imagination. No more. Check out what’s happened to the oil output plans for state oil company Petroleos de Venezuela SA over the past eight years. The vertical axis is barrels per day. The lower left corner of each line is where the company says its starting out. The upper right end of the line is where it plans to end up, months or years later.

PDVSA oil output plans 2005-2013

First, there’s the obvious: That the dude has been making and failing to fulfill unrealistic plans for a long, long time. Continue reading

Odd items in Chile census

With apologies to those who might have seen this earlier on my Twitter feed, at @guacamayan, here are a few oddities of the new Chile census figures.

Religion: Fewer than half the people 15-29 in the Bio Bio region declare themselves Roman Catholic. That is the only group in the country where Catholicism fails to make a majority. The bulk of those who aren’t Catholic are Protestant/Evangelical.

Migration: More than 60% of the immigrants from the Dominican Republic, Poland, the Philippines and Russia were female, while more than 60% of those from Pakistan, Iran, Morocco, Saudi Arabia, Turkey, Haiti, Egypt, Lebanon, India and Portugal were male. I don’t see much of a pattern there, except that the Middle East-North Africa group tends to be quite male. Continue reading

Chile census immigration notes

Unsurprisingly, Chile’s 2012 census showed a big increase in immigrants over the 2002 count — an increase of 86 percent to 339,536. That follows a 61 percent increase in the prior 10-year period.

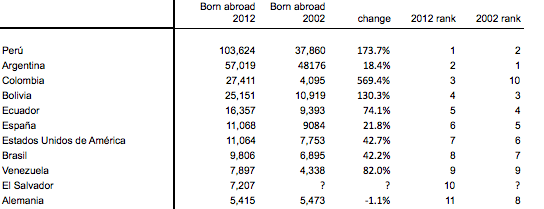
Here is what happened in the last 10 years, in chart form:

Chile immigration 2012

These are just the top 10 sources of immigrants — you want the whole list, click here to download. Long story short: Peru, Colombia and Bolivia are sending lots of migrants to Chile, each of those countries more than doubling its migrant populations in Chile. Venezuela also increasing its numbers, but keeping its same rank. The previously dominant Argentine-Chilean population grew more slowly. For all the hype about Spanish immigration to the New World, the numbers don’t reflect any major change in the number of Spaniards in Chile. That is quite different from the number of US-Americans, now over 11,000. The number of Germans fell off a bit, probably because a lot of those immigrants are old and are dying off. And at least one escaped. As a result, El Salvador knocked Germany out of the top 10. As far as movement in the rankings, the big move is from Colombia, up from #10 to #3, with a more than 6-fold rise in population. I am still eagerly awaiting the arrival of a single decent bandeja paisa in Santiago Centro.

UPDATE: Here is a chart of the how many immigrants are in Chile, normalized for the population of their birth countries.

chile census immigrants normalized

Venezuela fuel imports update: the derroche continues

Venezuela is buying ever more finished motor fuel from the USA. In January, it bought a record 113,000 barrels a day of the stuff. Meanwhile, it halted purchases of MTBE and special naphthas, which I previously referred to as the “good” imports. It’s grim.

Source: US EIA

Source: US EIA

Continue reading

Explaining those Venezuelan petrol imports from USA

(reposted cause first version got buried by my technical incompetence)

There has been a lot of hubbub over Venezuela’s growing petroleum imports from the USA.

Clearly, Venezuela’s refining system is breaking down. And the country’s policy of giving away fuel domestically and selling it to allies with basically free financing means that when Venezuela imports fuel, that is money coming right out of social programs and largely going to US refining companies, US taxes, and the US military-industrial complex. I don’t think this was the Bolivarian socialist revolution that anyone signed up for.

The long-term chart of US oil & refined product exports to Venezuela — which I have edited for clarity — tells a clear story. Here it is, courtesy of the US Energy Information Administration and too much time playing with Excel:

Venezuela fuel imports from USA in barrels a day

Venezuela fuel imports from USA in barrels a day (smoothed into 6-month rolling averages), click to enlarge

Continue reading

Colombia oil output stagnates a little more

Colombia’s Agencia Nacional de Hidrocarburos finally awoke from its summer slumber (apparently in response to my bitchy tweet) and posted June oil & gas output on its website. As anyone watching the grim news from Colombia might have guessed, it’s not going so well. (Click for full-size graphic.)

You’d almost think that the FARC has decided, aww, screw it — we’re never going to topple capitalism, but by George, we can keep Colombia below a million barrels a day! Output has now been basically flat for a year.

Update, now that this screen isn’t being used to watch The Wall — I mean, the opening ceremonies of the 2012 Olympics: here’s the year-over-year chart of oil output and gas sales. Click for full size. You’ll see that this month’s numbers show Colombia’s first year-on-year oil output decline since, well, since this spreadsheet started in 2007, anyway. A long frickin time.

Obviously the FARC are trying to fark up investments, especially in oil. It looks to me like they are pushing against a river.

Colombia gets more mineral-dependent. Now, mineral extraction gets tougher.

Colombia’s in a bit of a tough spot on natural resource exploitation. (But who isn’t, right?) On the one hand, the economy is getting more mineral-dependent every year. Here’s a chart showing what Colombia’s exports are made of, according to the central bank. The inner ring is 1995. The outer ring is 2012, through May. The red part is minerals. Cocaine exports aren’t included. Minerals — including fossil fuels — now make up more than half of Colombia’s legal exports, up from less than 42% every year through 2010. In other words, industrial and agricultural exports are becoming less important to Colombia’s foreign trade.

I know, the bars' thickness or radius should reflect the nominal amount of trade in each year. Excel doesn't do that.

(Below, see a chart of the overall export figures — industry has actually been doing well, just that minerals are kicking its culo.)

Continue reading

Chart o the day: Prices for dead Chilean pigs

Pork, ham, loin: name your corpse, it’s dead pig. And in Chile, more than half of it comes from AgroSuper, whose world’s biggest pork plant is now in the news. The pitch for these big industrial agricultural facilities is always that they’ll keep consumer prices down. Let’s see how that’s going, looking at prices in Santiago, according to the government’s Agricultural Studies and Policy Office.

All prices are in Chilean pesos. To get a sense of what these prices mean, minimum wage has climbed from 159,000 pesos a month to 182,000 pesos a month during this period. Let’s assume that people work 22 days a month. Take the most extreme case, that of costillar at the supermarket. A worker could get it for 3,000 pesos at the end of 2008, or 2.4 kilos for a day’s basic wages. This year, it’s averaging 5,000 pesos a kilo, or 1.65 kilos for a day’s work. That’s a big change. Continue reading